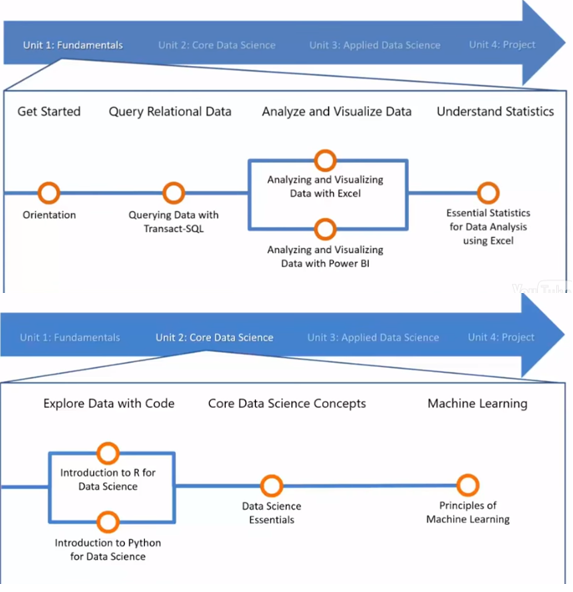
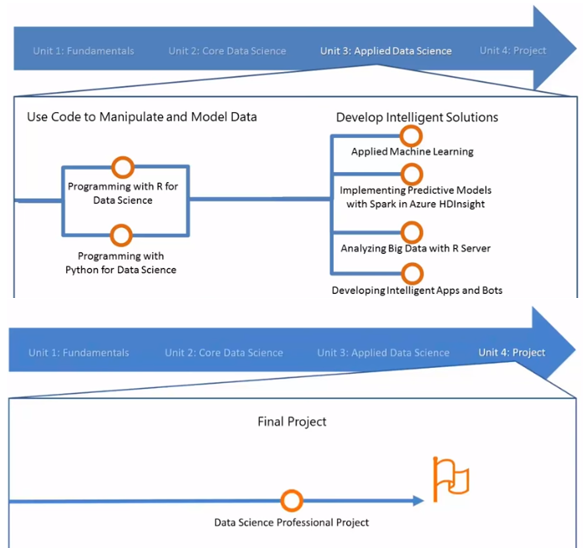
Module 1: The Data Science Curriculum
This module explains the journey of the data science course. It is very informative and I really like the way they delivered message > Easy and Clear!
Module 2: Data Science Fundamentals
- Working with data
- Exploring data
- Visualizing data
- Slicing and dicing data
- Pivot table and Pivot chart
As I have been working on data with Excel for few years so this module is relatively simple to me. I found one interesting part in visualising data, which is introduced by pretty Liberty (Sorry to say initially I was thinking why she is just sitting there, as a flower vase?! Surprisingly, she is actually an expert!)
Well, she introduced 2 of her favourite charts, which I am interested in:
- Histogram
- Graphical representation of the distribution of numerical data.
- Estimate of the probability distribution of a continuous variable
- Box and Whisker Chart
- Graphically depicting groups of numerical data through their quartiles in descriptive statistics
- Box plots may also have lines extending vertically from the boxes (whiskers) indicating variability outside the upper and lower quartiles
- Outliers may be plotted as individual points.
Both of them are very useful in data analysis!
Module 3, to be continued…
